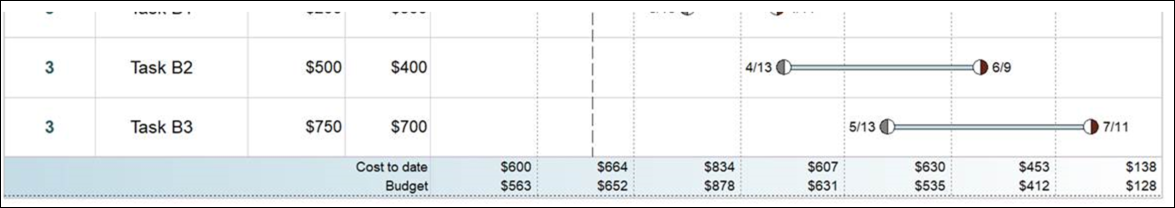
Add a table of numbers below the schedule
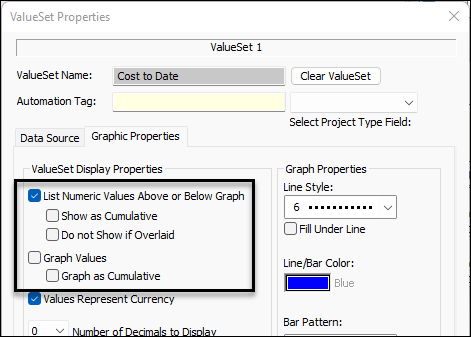
Question:     

I want to add a table to the bottom of my   schedule that show four types of funding broken out by fiscal years, and aligned with the calendar columns for the FYs. I have investigated valuesets, datasets and smartcolumn values, but I do not see the answer.  Suggestions?


Answer:  

The solution is to add a DataGraph, but choose to display only the values and not a graph of the value.  For example in the "Costs to Date"  ValueSet,          Graph Values.  Instead, List Numeric Values Above or Below Graph.

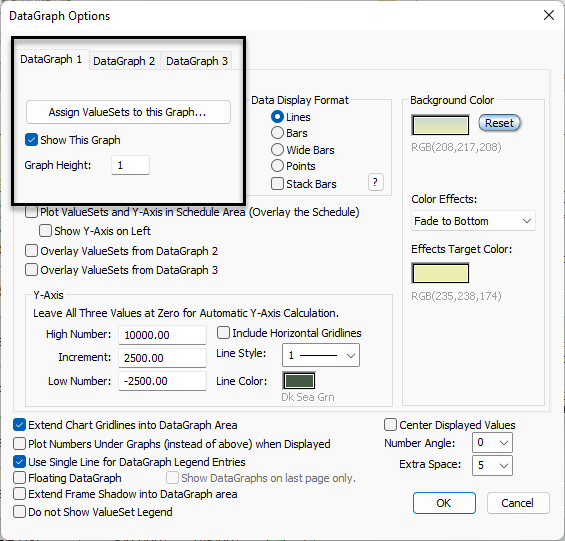
For the DataGraph, enter a value such as 0.5 or 1.0 depending on how many ValueSets you want to show.  Optionally, show the graph along with the numbers.


This example shows only numbers.  (The Show The Graph option was unchecked in this example.)


Related topics

Tracking and Graphing numbers (Milestones Help)  

DataGraph on last page only

DataGraph accuracy

Show curves and bars in DataGraph

Legend and DataGraph Placement


Applies to Milestones Professional:      2019        2021        2023        2025


The fast easy way to schedule your projects:  Milestones Software by KIDASA Software, Inc. www.kidasa.com

Copyright © 2025 KIDASA Software, Inc. All rights reserved.