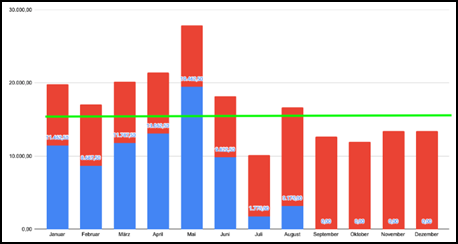
Question:I know how to make stacked bar chart in Milestones Professional, but I am having trouble adding a line in the same chart as below. Is this possible in Milestones Professional? Thanks.
|
Answer:
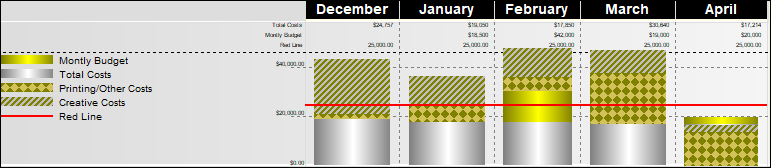
Yes, this is possible by overlaying one DataGraph onto another as in this example.
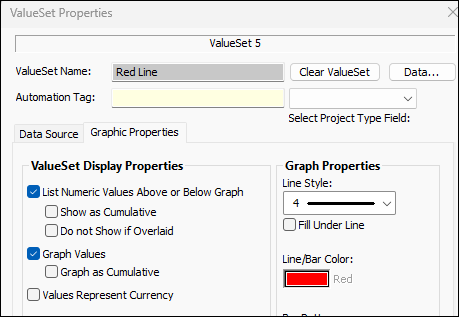
- Add a new ValueSet called Red Line. Make it a Type 1 (Keyed-in global values)
- Enter a few constant values for the new ValueSet, making sure it spans your date range. Set its graphic properties to be a red line. (See picture 1 below)
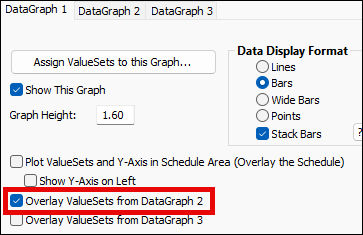
- Right-click the DataGraph and choose DataGraph Properties.
- Click the tab for DataGraph 2, add only the new ValueSet (Red Line). (Assign ValueSets to Graph button.)
- Click the tab for DataGraph 1 and
.bmp) Overlay ValueSets from DataGraph 2. (see Picture 2)
Overlay ValueSets from DataGraph 2. (see Picture 2)
Picture 1
Picture 2