ValueSet SmartColumn
|
A ValueSet SmartColumn totals and displays the values from specific ValueSets for each task row. A ValueSet SmartColumn will total only Type 2 and Type 4 ValueSets because they are specific to task rows. Type 2 values are entered by time period for each task, and Type 4 values reside in symbols on task rows. Optionally, indicator symbols can be displayed based on the values in the ValueSet SmartColumn. Contents
Add and format a ValueSet SmartColumn
Optional Indicators
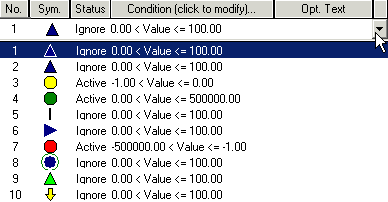
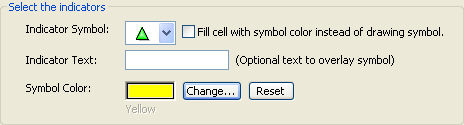
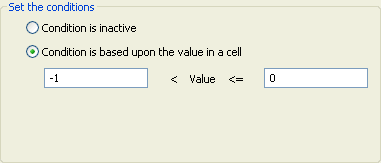
Example 1: ValueSet SmartColumnValueSet SmartColumns can display indicator symbols, color-fills, and text based on values which fall within user-defined ranges of values. As shown below, symbols automatically appear based on values which appear in the column cells. For values up to 300, the green triangle appears; for values from 301 to 700, the yellow square appears; for values above 700, the red arrow appears.
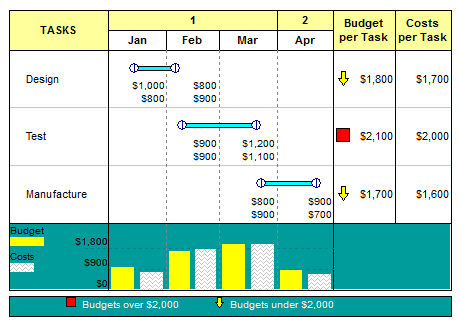
Example 2: ValueSet SmartColumnThe example below has two Type 2 ValueSets, "Budget" and "Costs." Monthly budget values and cost values are entered for each task. The values are totalled for each month, then displayed and graphed below the schedule. The "Budget per Task" and "Costs per Task" columns are ValueSet SmartColumns. The "Budget per Task" ValueSet SmartColumn totals the "Budget" Type 2 ValueSet values for each task row. The "Costs per Task" ValueSet SmartColumn totals the "Costs" Type 2 ValueSet values for each task row. Thus, ValueSet SmartColumns can total values from selected Type 2 or Type 4 ValueSets. The "Budget per Task" column also displays indicator symbols based on the column cell values.
Example 3: ValueSet SmartColumnThis example shows two Type 4 ValueSets, "Budget" and "Costs." Budget values and cost values are entered within each symbol. The values are totalled for each month, then displayed and graphed below the schedule. If the symbols move, then the values move with them. The "Budget per Task" and "Costs per Task" columns are ValueSet SmartColumns. The "Budget per Task" ValueSet SmartColumn totals the "Budget" Type 4 ValueSet values attached to symbols on each task row. The "Costs per Task" ValueSet SmartColumn totals the "Costs" Type 4 ValueSet values attached to symbols on each task row. Thus, ValueSet SmartColumns can total values from selected Type 2 or Type 4 ValueSets. The "Budget per Task" column also displays indicator symbols based on the column cell values.
|


 Note that a Values SmartColumn is different from a ValueSet SmartColumn. Only Type 2 and Type 4 ValueSets can be used for a ValueSet SmartColumn. These are the only two ValueSets that have values specific to task rows.
Related Topics