Issue tracking and trend analysis
Summary: Recently, a Fortune 100 high tech company began experiencing several unknown issues which negatively impacted one of their most critical IT environments. This environment consisted of multiple layers of technology (operating systems, servers, databases, storage, middleware, and enterprise software applications). The primary responsibility of this environment was to deliver a global services toolset to technical support and customer care agents. With each impact, key company resources were unable to perform their job, leading to severe bottlenecks and frustrated customers. Something had to be done.
As key IT stakeholders were called into daily meetings, the challenge became evident. The impacts were causing undesired behavior across multiple technologies and no one could predict when they would occur or end. To make matters worse, each technology vendor’s product had its own support site to submit and track service requests (cases). There was no way to view all the open issues using a single pane of glass approach.
As the investigation began, the team started off using a spreadsheet to compile all the vendor support cases. It quickly became apparent that this wouldn’t allow them to view the data in a timeline format for the purpose of identifying possible trends. This was an absolute necessity considering all the moving parts involved. Thankfully, one of the service delivery managers on the project team (a long time customer of KIDASA Software) decided to take matters into his own hands. Here’s a quick summary of his strategy using Milestones Professional to take on the tracking efforts, enable quick glance trend analysis, and enhance the overall communication process.
First, the spreadsheet of cases was imported into Milestones.
The schedule file contained weekly/monthly date headings.
A stoplight smart column was used to categorize the severity of each issue.
The issues/cases that were imported into Milestones were tracked as individual tasks. Since it was not known when the open issues would be resolved, an “initialize to current date of schedule” symbol constraint was used on the end symbol of each open task. This created ongoing tasks (or tasks with no definitive end date).
As cases were resolved, the symbol constraints for these tasks were de-activated, causing the automated task progression to stop.
Once the task’s status was changed to closed, the “root cause description” column was updated by keying in the appropriate resolution category (defect, misconfigured, etc.). This triggered the “root cause indicator” values/indicator smart column to display the appropriate user defined symbol. This provided excellent quick glance analysis.
A duration smart column was used to track how long each issue has been open.
Hyperlinks were used to provide 1 click access to each vendor’s support site.
The schedule could also be sorted and filtered to help with trend analysis.
Finally, drawing tools were used to point out observations that could help lead to root cause.
Below is a sanitized schedule that provides a visual overview of how the cases were tracked, as well as how Milestones helped the team identify trends that allowed them to focus on the right issues and bring stability back to the environment.

If you find yourself working on projects with similar challenges, try using Milestones Professional for quick and easy issue tracking and trend analysis. Before you know it, your heroic plan will improve communication efforts, provide a better way to view the timing of key events, and maximize your team’s ability to connect the dots and resolve the hottest issues that lead to greater stability.
View the schedule (JPG)
Download the schedule (.MLH) - Works with Milestones Professional 2019
Download the schedule (.MLJ) - Works with Milestones Professional 2021
|
|
|
|
|
 2019
2019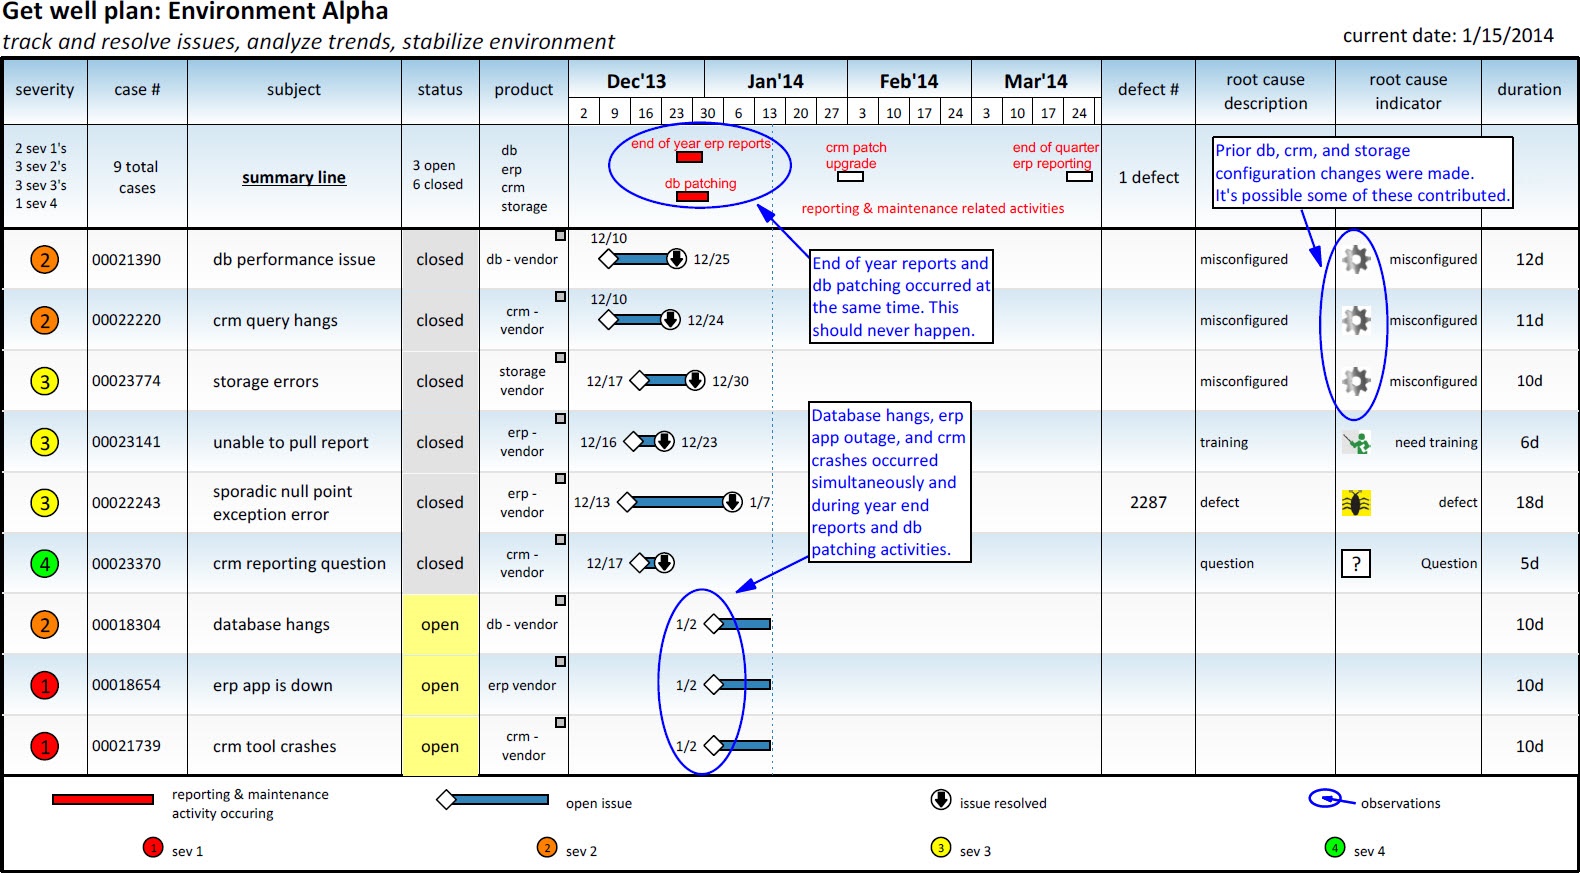