Create and format ValueSets
|
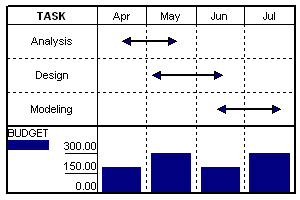
A ValueSet is a group of numerical values associated with either a time periodtime period, a time period and tasktime period and task, a symbolsymbol, a column's valuescolumn's values, or a sum of other ValueSetssum of other ValueSets. Values from ValueSets can be graphed in one or more of the schedule's DataGraphs. ValueSets are created and formatted under Tools | Graph Options | Set Up ValueSets. There are 5 types of ValueSets. Click one of the links below for specific instructions on creating and using each type of ValueSet: Type 1 ValueSets: Keyed in global valuesIn this type of ValueSet, the user defines one set of values for the entire schedule. Values are entered by time period (daily, weekly, monthly, quarterly, or yearly). It is these values that appear on the DataGraph. In the example below, one value is entered per month for the Budget ValueSet:
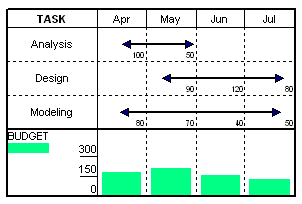
Type 2 ValueSets: Sum of values keyed into task rowsWith a Type 2 ValueSet, values are entered by time period for each task. In the example below, Analysis has an April budget value and a May budget value; Design has May, June and July budget values; and Modeling has four monthly budget values.
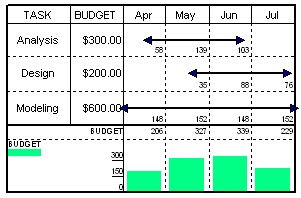
Type 3 ValueSets: Allocate column values across timelineWith a Type 3 ValueSet, values are entered in a column. The values entered are then spread across each task's time span. In the Analysis task in the schedule below, the $300 is distributed evenly across the task bar that covers April, May, and June. The amount for each month is based upon the total number of days in that month that the task bar covers. (Notice that the value for May is larger since it is a full month.) The distributed values for all tasks are totalled for each month, displayed above the graph, and graphed in the DataGraph area.
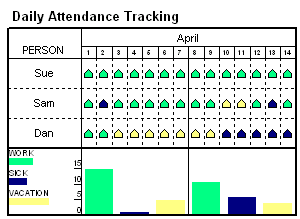
Type 4 ValueSets: Use values from symbolsType 4 ValueSets use values that are entered for each symbol. This type of ValueSet gives a great deal of flexibility and has many possible applications, include "What-if" analysis. The employee attendance example below has three of these Type 4 ValueSets. The example shows the daily attendance for three employees (Sue, Sam and Dan). The green symbols have a value of 1 entered for the "Work" ValueSet. The blue symbols have a value of 1 entered for the "Sick" ValueSet, and the yellow symbols have a value of 1 entered for the "Vacation" ValueSet. This schedule has ValueSet alignment set to weekly, so just a weekly total for each ValueSet is displayed in the DataGraph.
Type 5 ValueSets: Total of other ValueSetsType 5 ValueSets offer an easy way to display a total of other ValueSets. In the example below, Item 1 and Item 2 ValueSets are summed for the Total ValueSet:
|

Related Topics