Built in Dashboard templates
|
|||||||||||||||
Project Dashboard |
|||||||||||||||
|
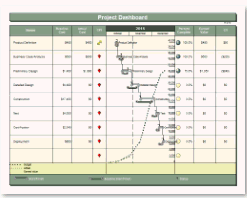
On the schedule: baseline and normal start/finish bars. Also, on the schedule, a graph representing Budget, Actual Cost and Earned Value (BCWP)." In the columns: - name, baseline and actual cost, percent complete, BCWP, cost variance (CV) and Cost Performance Index (CPI). An indicator for CPI displays Red for CPI less than 1, Green for CPI 1.3 or higher and Yellow for CPI between 1 and 1.3" Note:
|
|||||||||||||||
Microsoft Project Import - Project Funding Dashboard |
|||||||||||||||
|
On the schedule: baseline and normal start/finish bars. On the graph below schedule: budget vs/actual cost for each month." In the columns: a stoplight displays Red-Green-Yellow stoplight indicator based on the Microsoft Project Remaining Cost field. If Remaining Cost is greater than zero, a green indicator is shown. If Remaining Cost is zero, the indicator is yellow. If Remaining Cost is less than zero, a red indicator is shown meaning funds are exhausted.
|
|||||||||||||||
Dashboard Chart 4 |
|||||||||||||||
|
In the schedule: baseline and normal start/finish bars. Also, on the schedule, a graph representing Budget, Actual Cost and Earned Value (BCWP)." In the columns: - name, baseline and actual cost, Cost Performance Index (CPI), percent complete, earned value, cost variance (CV). An indicator for CPI displays Red for CPI less than 1, Green for CPI 1.3 or higher and Yellow for CPI between 1 and 1.3" From Microsoft Project Milestones brings in the numeric percent complete then adds a percent complete pie symbol. Note: Earned Value comes directly from Microsoft Project. However, instead of the timescaled values, the values are distributed across each task using Microsoft Project values for each task. This schedule can be customized and saved as a custom template. This format can be refreshed.
|
|||||||||||||||
Dashboard Chart 5 |
|||||||||||||||
|
Earned value calculation for this chart: Milestones Earned Value On the schedule: baseline start/finish and start/finish. A graph showing PV, EV, BAC and AC. Baseline Cost, Actual Cost and Percent Complete are from Microsoft Project. All other earned value information on this graph is calculated by Milestones Professional. " In the columns On the right: Cost, Remaining Cost, Actual Cost and Resource Initials" The Microsoft Project start+finish and baseline start+finish are imported" This schedule can be customized and saved as a custom template. This format can be refreshed. |
|||||||||||||||
Earned Value Dashboard |
|||||||||||||||
|
On the schedule: baseline and normal start/finish bars. Also, on the schedule, a graph representing Budget, Actual Cost, Earned Value (BCWP) and Planned Value (PV or BCWS) In the columns: - Schedule Variance and Cost Variance columns are shaded based on the values. Green for value > 0, Red for value < 0 and Yellow for value = 0. CPI displays an red indicator if the CPI is less than 1, Yellow if the CPI is between 1 and 1.3 and Green if the CPI is greater than 1.3." Earned value for this schedule is calculated by Milestones Professional using Baseline Cost, Percent Complete and Actual Cost from Microsoft Project. This schedule can be customized and saved as a custom template. This format can be refreshed.
|
|||||||||||||||
Dashboard Summary Chart |
|||||||||||||||
|
In the schedule: Baseline and Normal Start/Finish bars. A graph representing Budget and Actual Cost. In the columns: On Time indicator (Milestones calculation column baseline end minus end date), Cost OK indicator (Milestones calculation column baseline minus costs to date), Percent Complete, Who (Microsoft, Baseline Cost, Cost to Date (Microsoft actual cost) This schedule can be customized and saved as a custom template. This format can be refreshed.
|