(Click the question title for the answer)
|
I want to add a background color to every other line in order to read the schedule more easily. Show curves and bars in DataGraph I need to create a data graph with both bars and lines on the same DataGraph area. It appears that DataGraphs can either be bar graphs or line graphs, but not a mix. Suggestions? How can I delete commas for values which run in the thousands? For example 2371 is currently shown as 2,371. Due to space limitations I want value to appear without commas (as 2371). No task names on symbol following import I imported MS project to Milestone Pro but the task names do not appear above the milestones. See picture below:
When using the Percent Complete SmartColumn, how do you change the color of the pie chart that appears? Add a bitmap symbol to the toolbox
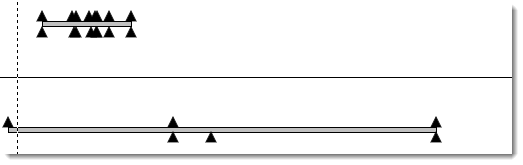
Add many symbols above and below a bar I want to show milestones above and below the task bar so I can have a condensed presentation format. Please advise the steps on how to show symbols above and below the task bar. I want to have text inside a horizontal bar on my schedule. Is this possible?
Automatically update % complete on a bar I want the percent complete value to populate as symbol text when a symbol-horizontal bar-symbol is added to the schedule. Copy a task row from one schedule to another Is there a way to copy a symbol row with text into another schedule? I’ve tried to copy and paste the row into a new chart, but it didn’t work.
Show vertical connections on top of or behind bars How can I get the vertical link behind the task bar and not in front?
|