|
One function of the Values SmartColumn is to display user-entered numbers and indicators (symbols, text, colors) based on those numbers. Optionally, hide the column values and display the indicators, only.
Create a Values SmartColumn that displays entered values and/or indicators
-
Choose Insert | Rows, Columns | New Column | Values.
-
The Indicators for Values Column appears. Here, choose which indicators appear based on the value in each column cell.
-
For Column to compare, the newly inserted column No Name Assigned should already be selected:

-
-
 Display numerical value also to display the user-enter values. Display numerical value also to display the user-enter values.
-
 Display numerical value also to display only the indicators. Display numerical value also to display only the indicators.
-
Align the indicator symbols as a left, center, or right position in the column cell.
-
 Pick the indicator symbology based upon the following conditions to display symbols, text, and/or color based on the column values. Pick the indicator symbology based upon the following conditions to display symbols, text, and/or color based on the column values.
-
Choose a Symbol size, as shown in the graphic above.
-
Click the drop-down arrow to view 10 active/ignored indicators and their conditions. All indicators are Ignored until a condition is created for them to appear, becoming Active. Also, choose to use one of three pre-selects to create Predefined Indicators.
-
Choose one of the ten settings. The Indicator Condition Settings dialog box opens, as shown below:
-
-
Choose an Indicator Symbol. These are the same symbols found in the toolbox.
-
OR, choose to Fill the cell with the symbol color, not the symbol itself.
-
Optionally, enter any Indicator Text to appear with the symbol or color fill.
-
Choose the Symbol Color for the symbol or color fill.
-
Condition is based upon the value in a cell and enter numbers to establish a value range.
-
-
The indicator will appear when a cell's value is greater than the first value and less than/equal to the second value.
-
Use neither commas nor $ signs when entering values.
-
Tips on entering a value range.
-
Choose OK, to return to the Pick the indicator symbology based upon the following conditions list.
-
Repeat steps 6 through 9 to display other indicators based on other conditions.
-
Values display options:Values display options:
-
 Show result as a percent to multiply by 100, with a % sign added (.35 becomes .35 x 100 = 35%). Show result as a percent to multiply by 100, with a % sign added (.35 becomes .35 x 100 = 35%).
-
When shown on Summary Bar, show average for the summary row values to be an average of lower-level values instead of a sum.
-
Just add a % sign after value to add % to the value (35 becomes 35%).
-
On Summary Rows show value in cell to override summary row values (which are normally sums or averages of lower-level values) with user-entered summary row values.
-
Automatic EV BCWS calculation is based on Baseline Dates (if possible) to assign the earned value calculation to baseline symbols in the schedule.
-
Interpret column value as a Julian date and display as a date.
-
-
This setting makes it possible to designate that a column of numbers can be displayed as dates. For example, 4/9/2009 has a Julian value of 733500 (which is 733,500 days after the first day of year 1.) When date SmartColumns are used in calculations, they are first converted to their Julian date, so if the result is also a Julian date and the result should be displayed as a date, then use this option. Values less than 1 and more than 2,000,000 are ignored.
-
Display resultant value as a Duration. Converts values entered into duration values. This feature is needed for importing duration values from an XML file.
-
Choose OK return to the Column Properties dialog box where column heading title can be added and the column can be formatted.
 A Values SmartColumn can contain numbers and/or indicator symbols based on the numbers from the same column or another column with values. A Values SmartColumn can contain numbers and/or indicator symbols based on the numbers from the same column or another column with values.
Enter values in the Values SmartColumn:
Typically, values should be entered at the lowest outline level. Values can then be automatically summed on the summary levels.
-
Click  (the toolbox Text tool.) (the toolbox Text tool.)
-
Click once in a column cell.
-
Enter the numerical value.
-
Use the up-arrow and down-arrow keys on the keyboard to move from cell to cell.
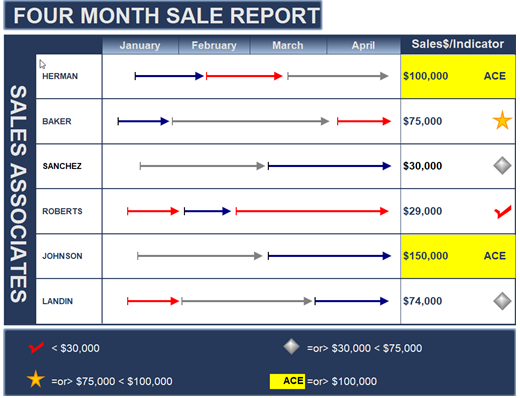
Example: Display values and indicators
This schedule has a Values SmartColumn, "Cost." Each symbol displays according to the value that is entered in each cell. The user defines what the symbol-display conditions are.
These are the settings which control which indicators appear and when they appear.
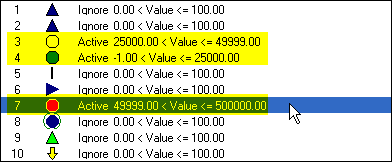
The green stoplight symbol will appear in a cell whose value is greater than -1 and less than or equal to 25,000. The yellow stoplight symbol will appear for values greater than 25,000 and less than or equal to 49,999. The red stoplight symbol will appear for values greater than 50,000 and less than or equal to 500,000.
|