Values SmartColumn
|
A Values SmartColumn can display values (user-entered numbers); symbols, text or colors based on those values; symbols, text, or colors based on another column's values; or a combination of these options. Contents About the Values SmartColumnThe Values SmartColumn allows the user to:
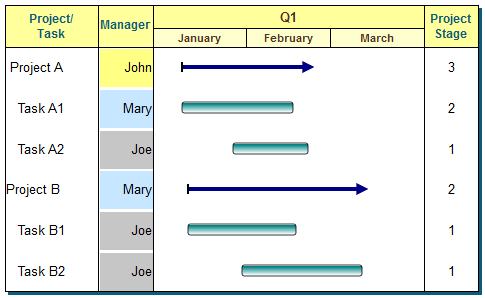
Values SmartColumn exampleTypically, a Values SmartColumn contains user-entered numbers that can be automatically totaled or averaged on summary levels. This SmartColumn can also display "indicators" (symbol, text, colors) based on values from the same column, or display indicators based on values and text found in another column. Additional options include converting the entered values to percentages with percent pies; adding a % sign to the value; and overriding the summary row values. In this example, the Cost column is a Values SmartColumn. Values are user-entered at the task level and automatically rolled-up, or summed, on the summary levels. The symbols display according to the values in each Cost column cell. The symbols and conditions are user-defined.
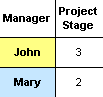
The user-defined value ranges that cause the symbols to display are shown in the legend. Values SmartColumn shows text color based on values in another columnThis schedule has two Values SmartColumns -- "Manager" and "Project Stage." The "Manager" column's text and background color changes automatically based on the values in the "Project Stage" column. For example, John is in charge of all projects in Stage 3. His name appears when any Project Stage value changes to "3".
|


Related Topics