Built in Earned Value templates
|
|||||||||||||||||||||||||||||||||
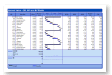
Graph on Schedule (timephased) |
|||||||||||||||||||||||||||||||||
|
This Import Wizard choice produces: All columns are from Microsoft Project (no Milestones calculations on this chart). Left Columns -1) Percent Complete, 2) Task Name Right Columns - 1) Baseline Cost (from Project), 2) ACWP from Project, 3) BCWP from Project, 4) BCWS from project, 5) EAC from Project Graph: Baseline Cost, EV, PV and AC from Project. EV is BCWP and PV is BCWS. Values are TimeScaled. On the first screen of the wizard, choose how much granularity to use (daily, weekly, monthly, quarterly).
|
|||||||||||||||||||||||||||||||||
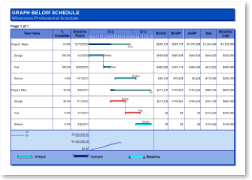
Graph Below Schedule (timephased) |
|||||||||||||||||||||||||||||||||
|
This Import Wizard choice produces: All columns are from Microsoft Project (no Milestones calculations on this chart). Left Columns - 1) Task Name, 2) Percent Complete, 3) Baseline Finish Right Columns - 1) BCWS (from Project), 2) BCWP from Project, 3) ACWP from Project, 4) EAC from project, 5) Baseline Cost from Project Graph: EV is BCWP from Project and PV is BCWS from Project. Values are TimeScaled. On the first screen of the wizard, choose how much granularity to use (daily, weekly, monthly, quarterly.)
|
|||||||||||||||||||||||||||||||||
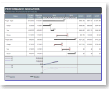
Performance Indicators (timephased) |
|||||||||||||||||||||||||||||||||
|
This Import Wizard choice produces: Column on the left: Task Name, Current Finish (Project Finish Date) and Baseline Finish (Project Baseline Finish Date) Columns on the right: Project BCWS, BCWP and ACWP fields Graph 1 - PV (Project BCWS field), EV (Project BCWP field) and AC (Project ACWP field) Graph 2 - SPI and CPI from Microsoft Project Values are TimeScaled. On the first screen of the wizard, choose how much granularity to use (daily, weekly, monthly, quarterly.)
|
|||||||||||||||||||||||||||||||||
Current Vs Expected Costs (timephased) |
|||||||||||||||||||||||||||||||||
|
This Import Wizard choice produces: Columns on the left: Percent Complete, Task Name. Columns on the right: Baseline Cost, EAC, BCWS, BCWP, ACWP. Graph: Baseline Cost and AC (Actual Cost), TimeScaled Values from Microsoft Project
|
|||||||||||||||||||||||||||||||||
EV Plus Remaining Funds (timephased) |
|||||||||||||||||||||||||||||||||
|
This Import Wizard choice produces: All columns are from Microsoft Project (no Milestones calculations on this chart). Left Columns - % Complete, SV, CV, Name Right Columns - BAC, PV, AC, EV Graph: EV is BCWP from Project and PV is BCWS from Project. Values are TimeScaled. On the first screen of the wizard, choose how much granularity to use (daily, weekly, monthly, quarterly.)
|
|||||||||||||||||||||||||||||||||
EV SPI Percentage Bar |
|||||||||||||||||||||||||||||||||
|
Specify either a number field or a date field on the last screen of the wizard. If a date field is specified, this field will be used to set the status for each task. If a number field is specified (Number 1, 2 ...Number 20, or SPI) then a percent complete is calculated based on the calendar days from the start of the task to the status date divided by the total duration of the task. The result of this calculation is then multiplied by the value in the number field. This result is used to set the status for the task.
|
|||||||||||||||||||||||||||||||||
Performance Review (timephased) |
|||||||||||||||||||||||||||||||||
|
This Import Wizard choice produces: Column on the left: % Complete, SV, CV and Task Name Columns on the right: Baseline Cost, BCWS, ACWP, BCWP and EAC Graph: PV (Project BCWS field), EV (Project BCWP field), Baseline Cost, and AC (Project ACWP field) Values are TimeScaled. On the first screen of the wizard, choose how much granularity to use (daily, weekly, monthly, quarterly.)
|
|||||||||||||||||||||||||||||||||
Performance Review 2 (timephased) |
|||||||||||||||||||||||||||||||||
|
This Import Wizard choice produces: Left Columns - SPI, CPI, EAC, Task Name Right Columns - Project BCWS, ACWP, BCWP, and % Complete fields Graph - PV (Project BCWS field), EV (Project BCWP field), Baseline Cost, and AC (Project ACWP field)
|
|||||||||||||||||||||||||||||||||
CPI SPI EV Fields (timephased) |
|||||||||||||||||||||||||||||||||
|
Earned Value - CPI, SPI and Other EV Fields This is a good format for displaying earned value fields. Columns on the left side of schedule: EAC, Task Name, Finish, Baseline Finish Columns on the right side of schedule: BCWS, BCWP, ACWP, Baseline Cost, Cost All fields are from Microsoft Project. Graph shows timescaled values from Microsoft Project.
|
|||||||||||||||||||||||||||||||||
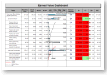
Earned Value Dashboard |
|||||||||||||||||||||||||||||||||
|
On the schedule: baseline and normal start/finish bars. Also, on the schedule, a graph representing Budget, Actual Cost, Earned Value (BCWP) and Planned Value (PV or BCWS) In the columns: - Schedule Variance and Cost Variance columns are shaded based on the values. Green for value > 0, Red for value < 0 and Yellow for value = 0. CPI displays an red indicator if the CPI is less than 1, Yellow if the CPI is between 1 and 1.3 and Green if the CPI is greater than 1.3." Earned value for this schedule is calculated by Milestones Professional using Baseline Cost, Percent Complete and Actual Cost from Microsoft Project. This schedule can be customized and saved as a custom template. This format can be refreshed.
|
|||||||||||||||||||||||||||||||||
Condensed Earned Value |
|||||||||||||||||||||||||||||||||
|
Columns on the left: 1) Name 2) Budget (Project Baseline Cost field), 3) Actual Cost, 4) PV (Calculated by Milestones), 5) EV (Calculated by Milestones) Columns on the right: 1) SV, Schedule Variance, Calculated by Milestones, 2) CV, Cost Variance, Calculated by Milestones, 3) SPI, calculated by Milestones, 4) CPI, calculated by Milestones, 5) Percent Complete (from Project) Graph: Non-Timescaled PV, EV, Baseline Cost and AC calculated by Milestones Professional |


Related Topics