Page Layout
|
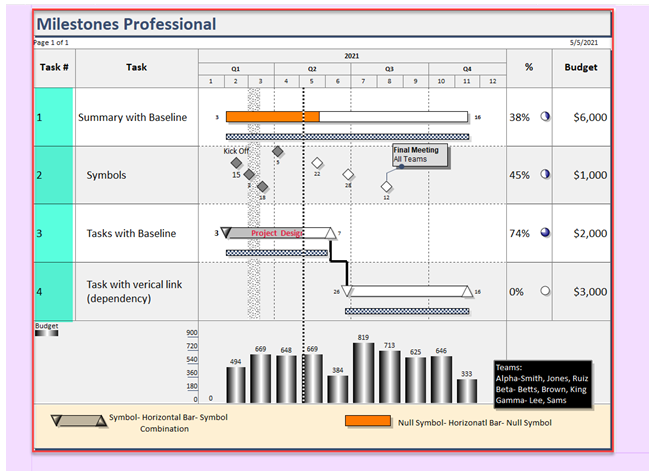
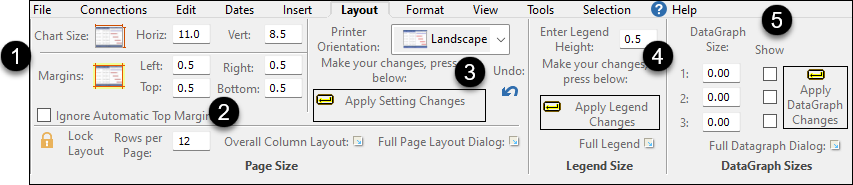
The Layout tab is used to change the size of a schedule, set the margins, set the legend size and more. This topic also explains how to add and delete pages. Tutorial Lesson 1 - Format a schedule Contents
Set the schedule's height, width, margins and density (how many rows per page):
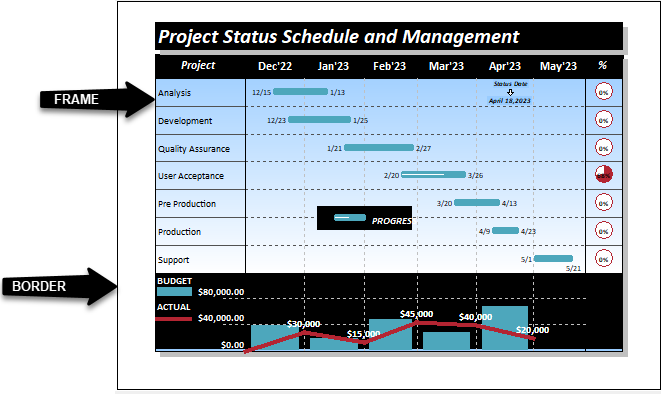
Frame and background optionsClick Format | Frame Highlights | Background Color, border, frame, corners
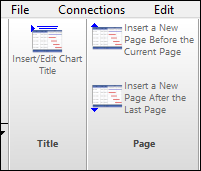
Add /Delete pagesAdd a pageWhen entering tasks in a column, when the last task on a page is reached, pressing the keyboard down arrow will automatically add a new page. If nothing is added to the page, the page will be deleted when the schedule is saved. To retain a blank page at the end of the schedule, be sure to add something to it (like an invisible symbol.) It's also possible to choose one of the options in the Page group on the Insert tab.
Delete a pagePages can be easily deleted. Just navigate to the page to be deleted and choose Edit | Delete | Current Page.
Usable area of paperThese values are informational only and represent the values returned by the current Windows Printer Driver. The yellow portion represents the non-printable regions of the paper as reported by your printer driver. In this example, the printer values reported are from an Hewlett-Packard Laserjet printer.
Different printers will report different values for the usable area of paper. The example below shows the graphical representation as reported by a QMS ColorScript 100.
Notice that the graph shows that the schedule will not fit into the usable area with the default margin settings. The settings for the left and right margins will have to be increased in order for the schedule to print properly. The chart inside the graph will scale to fit the printable regions when the margins are changed. The following screen shows the same QMS ColorScript 100 printer’s usable area of paper with the margins adjusted to fit within the printable region:
|
.bmp)
 or Portrait:
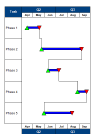
 Height of 0.5
 The
The 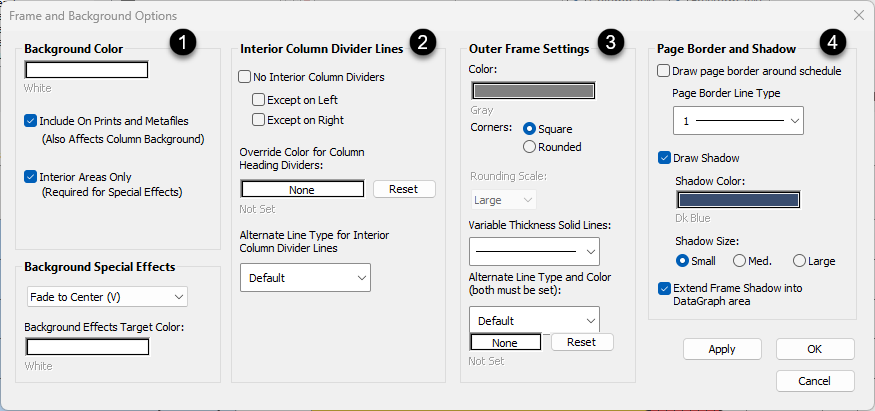


Related Topics