ValueSet type 4: Use values from symbols
In the Type 4 ValueSet, values are entered for symbols on the schedule. Each symbol can contain values for any or all of the nine possible ValueSets. Thus, a symbol can contain a budget value, cost value, manhours value and more. When the symbol is moved, the values move with the symbol. The numbers that appear on the DataGraph represent the sum of these values for each time period. See: Tutorial Lesson 11 - Introduction too ValueSets and DataGraphs and Tutorial Lesson 12 - More ValueSets and DataGraphs
Create a Type 4 ValueSet:
-
Choose Tools | Graph Options | Set Up ValueSets.
-
For Set Alignment For ValueSets, choose either Daily, Weekly, Monthly, Quarterly, or Yearly.Daily, Weekly, Monthly, Quarterly, or Yearly.
-
Choose the first available Create/Edit button to set up the new ValueSet.
-
Enter a ValueSet Name which is meaningful to you. This name will appear in the DataGraph legend next to its line/bar graph color.
-
Choose
 Type 4: Use Values from Symbols.
-
-
Ignore Values after Status Date: Only the values attached to symbols before the status date will be displayed and graphed.
-
Ignore Values outside Schedule Start and End Dates: Only the values attached to symbols within the schedule start and end date range will be displayed and graphed.
-
Note that symbol values can only be entered after the ValueSet has been created.
-
-
Choose the Graphic Properties tab:
-
ValueSet Display PropertiesValueSet Display Properties
-
-
List Numeric Values Above Graph: Values appear above DataGraph.
-
Show as Cumulative: Values appear above DataGraph as cumulative values. Learn more.
-
Graph Values: Values are converted to line or bar graphs.
-
Graph as Cumulative: Cumulative values are converted to line or bar graphs. Learn more.
-
Values Represent Currency: Add currency symbol to values. Affects ValueSet values above/below DataGraph, Y-axis values, and ValueSet values under each task row.
-
Number of Decimals to Display: Choose 0 - 6 decimal places when displaying values. Affects ValueSet values above/below DataGraph, Y-axis values, and ValueSet values under each task row.
-
Show Values Under Each Task Row: For Type 2, 3 and 4 ValueSets, only. Display values on the task row and within the appropriate time periods. Learn more.
-
Exclude Name of ValueSet in Task Row: For Type 2, 3 and 4 ValueSets, only. Hide the name of the ValueSet which will otherwise display in the column area, in line with its value on the task row. Learn more.
-
Suppress Values of Zero: To not display values of 0 (zero) above/below the DataGraph or on task row ValueSet value displays. Learn more.
-
Suppress Leading Values of Zero: For ValueSet numbers such as 0.35 to appear as .35. Learn more.
-
Show Average instead of Sum: Normally, ValueSet values are totalled by time period, then displayed above the graph and graphed as summed values. This option changes that computation to an average of values.
-
Ignore Zero values when computing average: Does not consider ValueSet values of zero when computing average.
-
-
-
Graph PropertiesGraph Properties
-
-
Line Style: For line graphs in the DataGraph, choose a thin line, dotted line, dashed line or thicker line.
-
Line/Bar Color: Choose a line color or bar fill color.
-
Bar Pattern: For bar graphs in the DataGraph, choose a pattern which fills each bar. Marbled patterns are full-colored bitmaps which will ignore any foreground or background color settings. Use of these increases the size of printer files and metafiles, especially on high-resolution printers. Thus, printing time may be increased.
-
Solid Bar Target Color: For the solid Bar Pattern, choose a Target Color for fading from the Line/Bar Color to this Target Color. For other bar patterns, the Target Color fills the white area shown in the bar pattern sample.
-
Solid Bar Effect: For the solid Bar Pattern only, choose a gradient fill pattern for fading from the Line/Bar Color to this Target Color.
-
-
-
-
Choose OK. Create or edit other ValueSets.
-
Choose OK to return to the schedule.
Enter values for symbols on the schedule:
Values for the Type 2 ValueSet should be entered at the lowest activity level.
-
Click
 .
. -
Click once on the symbol. This will display the Selection menu.
-
Choose the ValueSets tab.
-
Enter values for any available ValueSets. Press the
 apply button.
 -
Repeat for other symbols.
Example: Type 4 ValueSet
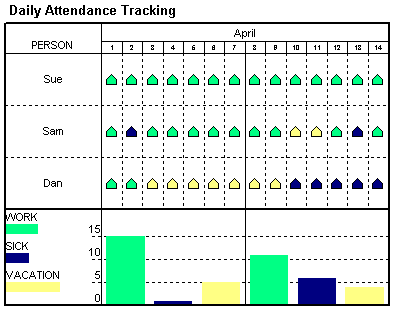
The example below has three Type 4 ValueSets. The example shows the daily attendance for three employees (Sue, Sam and Dan). The green symbols have a value of 1 entered for the "Work" ValueSet. The blue symbols have a value of 1 entered for the "Sick" ValueSet and the yellow symbols have a value of 1 entered for the "Vacation" ValueSet. This schedule has ValueSet alignment set to weekly, so just a weekly total for each ValueSet is displayed in the DataGraph.
Set a default value for a type 4 ValueSet
-
Double-click a symbol in the toolbox.
-
Click the ValueSet tab.
-
The ValueSet names will be listed. Enter a default value for one or more ValueSets.
 If you have a situation where each symbol will have the same values, set a default value in the toolbox. The default value will be used whenever that symbol is added. Double-click the symbol in the toolbox and choose ValueSet Defaults.
Related Topics