|
|
|

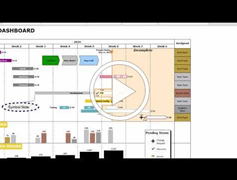
Excel Import multiple milestones per row
I would like to add multiple milestones per task, from an excel spreadsheet as well as per excel sheet info associated text to said milestones. I have attached a screenshot. How can I do this?
What are the ways Milestones can interact with Excel?

Why are some symbols not filled
Why are some of the symbols and connectors on my chart filled in while others are not?

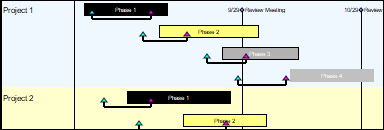
Separate projects visually on a schedule
I am showing several projects on one chart. I need some ideas for separating them visually.
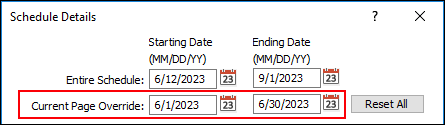
Change the date range for a single page on the schedule
After inserting the second page, how do you change the date headings on it without changing the first page?
Dashed connectors appear when solid is set in the toolbox
I have set up a solid horizontal connector in the toolbox but all of the connectors on the schedule are coming out dashed. Please advise.

Highlight Changed Dates when Refreshing
Is it possible to highlight the milestones which have changed after running a Milestones refresh to update my presentation schedule with dates from Microsoft Project?
I have attached a chart that I created in Milestones Professional. This is a chart that is used for a lot of briefings for the government. Unfortunately my engineer and I opened it to make some changes and if you try a lot of the bars are locked and I cannot change the links or delete.
Copy a column of text from Milestones to Excel
I'm seeking help on how to export a column of text (Task Names) from Milestones Professional to Microsoft Excel.
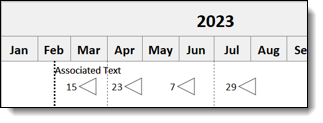
Show only the month with the symbol
How can I make the symbol date show only the month?
I have moved a master schedule and its slaves to a different folder on my PC. How do I get it to update the links for the slave schedules so that the point to the new folder I've moved them too?
How can I show some of my text at an angle so I can get more information onto my crowded schedule?
I have two data graphs on my chart. Since my timeline covers about 2 years, the data table associated with the graph is not legible. I would like to have only the graph with no data table. From what I can tell, the only options I have are Data Above the Graph or Data Below the Graph. However, I want to leave out the numbers entirely.
Using substitutable text strings and default symbol text
I'm making a "no-columns" presentation schedule. Is there an easy way to attach my task names as symbol text?
I want to center the numbers of my task number column. I can't seem to select the entire task number column and do all at once.
How to check Your software's rev. date
I want to see if I have the latest version of Milestones Professional. How can I find my software's "rev. date"?
Download and install the latest software update
I would like to get the latest update for my Milestones software. What is the easiest way to do this?