SmartColumns

SmartColumns automatically fill according to schedule information that is entered, based on the schedule or calculated.  In this topic learn about:


Add a SmartColumn

General task columns

Date SmartColumns

Columns which do calculations and display indicators

Earned Value SmartColumns

Duration SmartColumns

Columns useful for showing status

Blanking entries for some rows

Compute and display rolled-up summary values for SmartColumns


Add a SmartColumn

  1. Click the arrow   next to Insert | Rows, Columns | New Column.
  2. Pick a column type.
  3. Choose Insert Column.
  4. A new column will be inserted directly to the left or right of the column whose heading was clicked.  If on the left side of the schedule, the new column will appear to the left.  If on the right side of the schedule, the new column will appear to the right.


A default title is automatically added for inserted SmartColumns.Start Date


General task columns

Date SmartColumns

Columns which do calculations and/or display indicators
  • Calculation/Indicator - A Calculation/Indicator SmartColumn can display calculation results; symbols, text or colors based on those results; symbols, text, or colors based on another column's values; or a combination of these choices, as well as convert calculation results to percentages with matching percent complete pies.
  • Stoplight - Stoplight SmartColumn to display built-in green, yellow, red, and blue indicators, or up to 10 custom stoplights.
  • Values - A Values SmartColumn can display values (user-entered numbers); symbols, text or colors based on those values; symbols, text, or colors based on another column's values; or a combination of these options.
  • ValueSet - totals and displays the values from specific ValueSets for each task row.  A ValueSet SmartColumn will total only Type 2 and Type 4 ValueSets because they are specific to task rows. Type 2 values are entered by time period for each task, and Type 4 values reside in symbols on task rows. Optionally, indicator symbols can be displayed based on the values in the ValueSet SmartColumn.
  • Symbol Count - counts the symbols on a task row and displays the total 

Columns which show duration
  • Duration - shows the amount of time worked
  • Used Duration - shows the amount of time that represents the completed portion of the task
  • Remaining Duration - shows the amount of time that represents the uncompleted portion of the task
  • Baseline Duration - show the amount of time planned to work according to the baseline symbols

Columns helpful for showing status

Columns used to calculate Earned value

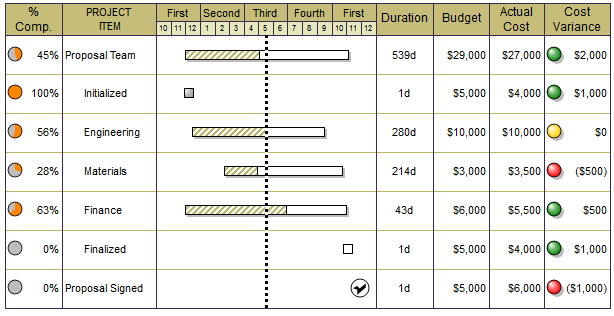
Milestones Professional makes it easy to calculate and display Earned Value metrics with a simplified SmartColumn selection screen.

Here are the available columns.  Learn more about earned value: Earned Value

Entered EV columns:  

Budget-at-Completion (required)

also called Budget, Performance Measurement Baseline (PMB) or Baseline Cost.  Once on the schedule, this  column acts as a Values SmartColumns, and values must be manually entered.

Actual Cost (required)

Also called Actual Cost of Work Performed (ACWP) or AC.  Once on the schedule, this  column acts as a Values SmartColumns, and values must be manually entered.
Calculated EV columns:
Planned Value (PV) also called Budgeted Cost of Work Scheduled (BCWS). Calculates expected budget expended to date; planned cost to date.
Earned Value (EV) also called Budgeted Cost of Work Performed (BCWP). Calculates the value of the work completed; budget x percent complete.
TCPI To-Complete Performance Index (TCPI)  TCPI = (Budget-at-Completion - Earned Value) / (Budget-at-Completion - Actual Cost). Calculates the Cost Performance Index (CPI) required through the remainder of the task to stay within the stated budget; effectively the reverse of CPI.
CV Cost Variance (CV) - CV = Earned Value - Actual Cost. Calculates the dollar value of what was accomplished to date against what has actually been spent.
SPI Schedule Performance Index (SPI) - SPI = Earned Value / Planned Value. Calculates a ratio of the value of what was accomplished (EV) versus what was budgeted to accomplish it (PV), up to the status date.
SV Schedule Variance (SV)
SV = Earned Value - Planned Value. Calculates the dollar value of what was accomplished to date against what was budgeted to have been spent to date.
EAC

Estimate at Completion (EAC)
EAC forecasts the expected total costs to be accrued over the life of the project based on current trends.  

Overrun-to-Date method: EAC = (Budget-at-Completion - Earned Value) + Actual Cost. Assuming spending patterns remain the same, EAC: Overrun-to-Date forecasts the total amount to be spent by adding costs incurred to date to the remaining work to be earned.

Cumulative CPI Method: EAC = ((Budget-at-Completion - Earned Value) / CPI) + Actual Cost. The EAC: Cumulative CPI Method forecasts the total amount to be spent by adding costs incurred to date to the remaining work to be earned, which has been weighted against the current CPI performance value.

Cumulative CPIxSPI Method: EAC = ((Budget-at-Completion - Earned Value) / CPIxSPI) + Actual Cost. The EAC: Cumulative CPIxSPI Method forecasts the total amount to be spent by adding costs incurred to date to the remaining work to be earned, which has been weighted against the combined current CPI and SPI performance values

VAC

Variance at completion

Variance at Completion (VAC)
VAC forecasts the difference between the Budget-at-Completion and the expected total costs to be accrued over the life of the project based on current trends:

Cumulative CPI Method: VAC = EAC: Cumulative-CPI-Method minus Budget-at-Completion.

Overrun-to-Date method: VAC = EAC: Overrun-to-Date minus Budget-at-Completion.

Cumulative CPIxSPI Method: VAC = EAC: Cumulative-CPIxSPI-Method minus Budget-at-Completion.


Blank out SmartColumn cells

For rows which do not contain any data, yet the SmartColumn value and indicator appear automatically, the SmartColumn value can be displayed as blank.  This feature is especially useful for task rows which are there for appearance, only.

Blank out SmartColumn cells for a task row:
  1. Right-click the task row and choose Blank SmartColumn Cells.  (To re-display the blanked cell data, choose Show SmartColumn Cells.)

Blank out all SmartColumn cells for Blank lines
  1. Go to Tools | Program Options | General.

  2. Blank SmartColumn Cells on all Blank Lines.

Blank out the SmartColumn value for a single cell
  1. Click  (the toolbox Arrow tool.).

  2. Click once on the task row.

  3. Click again to select the cell.

  4. In the toolbar Selection tab, Blank SmartColumn Data in this Cell.

  5. Blank SmartColumn Cells on all Blank Lines.


Compute and display rolled-up summary values for SmartColumns:

  1. Choose Layout | Other | Summary Bar Settings...

  2. Compute Rolled-up Values for Value/Calc SmartColumns to sum lower-level column values to upper-level summary column entries.

  3. Under When to Draw, check Always to have Milestones draw summary bars.

Example:  ValueSet SmartColumn Roll-up

In the example below, the "Cost" column is a ValueSet SmartColumn. The Summary row total is the sum of the lower level task values (Analysis, Design, and Modeling). Also, notice that the individual task row values are totals of the ValueSet values entered for each task row.


Related Topics

  1. Columns with indicators
  2. About the schedule columns


Guided Help Home


The fast easy way to schedule your projects:  Milestones Software by KIDASA Software, Inc. www.kidasa.com

Copyright © 2025 KIDASA Software, Inc. All rights reserved.